This Isn’t a School Ranking
I’m not going to tell you which school district your household should choose.
School programs, services, attendance boundaries and individual student needs deserve their own research.
This page answers the housing side of the decision:
What did homes cost? How much of the market was within a certain budget? How often did a particular kind of house sell? And what changed when buyers crossed a school-district line?
School assignments can vary by exact address. Always verify the assigned schools directly with the district before making a school-driven purchase decision.
Start With the Question You’re Actually Trying to Answer
What Did Your Budget Actually Reach?
A district median tells you where the middle sale landed.
It does not tell you whether your budget would have reached 5% of the market, 30% of it, or most of it.
Enter your maximum purchase price and I’ll show you how much of each district’s 2026 closed-sale market actually fell within reach.
Source: 2,868 QA-clean MARIS single-family sales, January 1–October 5, 2026; full details in the methodology below.
How Hard Is It to Find the House You Actually Want?
Price is only one way a home search gets difficult.
You can have enough money and still struggle because the house itself doesn’t come up very often.
Tell me what you’re looking for. The tool will compare actual closed sales across the districts in the dataset.
Source: the same 2,868-sale dataset as the budget tool above.
Can I Buy a House in Lindbergh School District for $250,000?
Yes—but the bigger question is how many chances you would have had.
From January 1 through October 5, 2026, 10 of 146 qualifying Lindbergh single-family home sales closed for $250,000 or less. That’s 6.8% of the market we analyzed.
So $250,000 did buy homes in Lindbergh.
But it put a buyer into a narrow part of the district’s market.
At $300,000, the number increased to 32 sales, or 21.9%.
At $400,000, it increased to 76 sales, or 52.1%.
That’s the difference between asking “Can I buy there?” and asking “How much of the market can I actually shop?”
A budget can technically work and still leave you waiting for a house you actually want.
Is $300,000 Enough to Buy in Mehlville School District?
It bought a meaningful part of the market—but not most of it.
In the study period, 83 of 285 qualifying Mehlville single-family home sales closed for $300,000 or less. That’s 29.1%.
At $350,000, the picture changed: 143 sales, or 50.2% of the market, closed at or below that price.
That $50,000 difference didn’t simply buy a little more house.
Historically, it moved the buyer from shopping less than a third of the district’s closed sales to reaching about half of them.
Affton or Mehlville: Which Gave a $300,000 Buyer More Options?
In this dataset, $300,000 reached 74.6% of Affton’s qualifying sales and 29.1% of Mehlville’s.
That doesn’t make one district better.
It means the same budget occupied a very different position in each housing market.
A $300,000 buyer in Affton was shopping across most of the 2026 closed-sale market we analyzed.
A $300,000 buyer in Mehlville was shopping below the middle of the market.
That’s the kind of difference a district median alone can hide.
What does $300,000 buy in St. Louis County—and which school district gives you more house?
Among homes that closed for $250,001 to $300,000 in 2026, Ferguson-Florissant gave the most house: a median of 2,051 square feet at $136 a square foot. The runner-up was Hazelwood, at 1,944 square feet and $143. Maplewood-Richmond Heights gave the least, 1,088 square feet at $241. The newest homes were in Valley Park, built 1993 on median.
Here, “what $300,000 buys” means the homes that closed between $250,001 and $300,000: the top of a $300,000 budget, where a buyer spending close to the full amount actually shops. 289 homes in the 22 districts closed in that range.
| Budget | Most house | Runner-up | Least house |
|---|---|---|---|
| $250,000 | Ferguson-Florissant1,756 sq. ft. · $127/sq. ft. | Hazelwood1,648 sq. ft. · $134/sq. ft. | Webster Groves868 sq. ft. · $254/sq. ft. |
| $300,000 | Ferguson-Florissant2,051 sq. ft. · $136/sq. ft. | Hazelwood1,944 sq. ft. · $143/sq. ft. | Maplewood-Richmond Heights1,088 sq. ft. · $241/sq. ft. |
| $350,000 | Hazelwood2,669 sq. ft. · $126/sq. ft. | Mehlville R-IX1,725 sq. ft. · $191/sq. ft. | Kirkwood R-VII1,292 sq. ft. · $249/sq. ft. |
| $400,000 | Hazelwood3,016 sq. ft. · $118/sq. ft. | Affton 1012,501 sq. ft. · $144/sq. ft. | Kirkwood R-VII1,476 sq. ft. · $253/sq. ft. |
| $500,000 | Mehlville R-IX2,935 sq. ft. · $161/sq. ft. | Parkway2,787 sq. ft. · $176/sq. ft. | Webster Groves1,900 sq. ft. · $262/sq. ft. |
Swipe the table sideways to see every column.
More square feet isn’t the only way to get more house. Look at the year-built column: a smaller, newer house can mean fewer near-term repairs, and the days-on-market column shows how fast that part of each district moved.
The $300,000 table
| District | Sales | Median sq. ft. | Median $/sq. ft. | Median year built | Median CDOM |
|---|---|---|---|---|---|
| Ferguson-Florissant | 16 | 2,051 | $136 | 1963 | 19.5 |
| Hazelwood | 45 | 1,944 | $143 | 1980 | 13 |
| Mehlville R-IX | 45 | 1,629 | $174 | 1962 | 4 |
| Pattonville | 32 | 1,533 | $190 | 1966 | 5.5 |
| Affton 101 | 27 | 1,465 | $185 | 1954 | 8 |
| Rockwood R-VI | 17 | 1,450 | $199 | 1967 | 4 |
| Parkway | 16 | 1,438 | $203 | 1966 | 26 |
| Bayless | 12 | 1,436 | $181 | 1957 | 5.5 |
| Valley Park | 5 | 1,355 | $210 | 1993 | 4 |
| Lindbergh | 22 | 1,327 | $217 | 1956 | 6 |
| Webster Groves | 21 | 1,280 | $234 | 1948 | 21 |
| Kirkwood R-VII | 10 | 1,236 | $219 | 1948 | 16 |
| Maplewood-Richmond Heights | 7 | 1,088 | $241 | 1930 | 9 |
Swipe the table sideways to see every column.
Which St. Louis County school district gives you more house for $250,000?
Among homes that closed for $200,001 to $250,000 in 2026, Ferguson-Florissant gave the most house: a median of 1,756 square feet at $127 a square foot. The runner-up was Hazelwood, at 1,648 square feet and $134. Webster Groves gave the least, 868 square feet at $254. The newest homes were in Hazelwood, built 1967 on median.
See the $250,000 table
| District | Sales | Median sq. ft. | Median $/sq. ft. | Median year built | Median CDOM |
|---|---|---|---|---|---|
| Ferguson-Florissant | 35 | 1,756 | $127 | 1959 | 18 |
| Hazelwood | 76 | 1,648 | $134 | 1967 | 10.5 |
| University City | 5 | 1,473 | $153 | 1954 | 47 |
| Mehlville R-IX | 30 | 1,405 | $174 | 1958 | 15 |
| Pattonville | 18 | 1,378 | $170 | 1962 | 5.5 |
| Bayless | 8 | 1,296 | $179 | 1947 | 31 |
| Valley Park | 5 | 1,264 | $172 | 1958 | 2 |
| Rockwood R-VI | 8 | 1,192 | $212 | 1955 | 5.5 |
| Ritenour | 22 | 1,172 | $192 | 1950 | 13 |
| Lindbergh | 5 | 1,168 | $188 | 1958 | 4 |
| Parkway | 6 | 1,084 | $226 | 1963 | 11.5 |
| Affton 101 | 19 | 1,044 | $214 | 1950 | 19 |
| Webster Groves | 6 | 868 | $254 | 1951 | 21 |
Which St. Louis County school district gives you more house for $350,000?
Among homes that closed for $300,001 to $350,000 in 2026, Hazelwood gave the most house: a median of 2,669 square feet at $126 a square foot. The runner-up was Mehlville R-IX, at 1,725 square feet and $191. Kirkwood R-VII gave the least, 1,292 square feet at $249. The newest homes were in Valley Park, built 1994 on median.
See the $350,000 table
| District | Sales | Median sq. ft. | Median $/sq. ft. | Median year built | Median CDOM |
|---|---|---|---|---|---|
| Hazelwood | 13 | 2,669 | $126 | 1988 | 13 |
| Mehlville R-IX | 60 | 1,725 | $191 | 1973 | 4.5 |
| Parkway | 50 | 1,648 | $202 | 1968 | 7.5 |
| Pattonville | 23 | 1,620 | $200 | 1971 | 7 |
| Rockwood R-VI | 33 | 1,588 | $209 | 1976 | 7 |
| Webster Groves | 13 | 1,560 | $214 | 1949 | 4 |
| University City | 8 | 1,520 | $209 | 1934 | 6 |
| Lindbergh | 20 | 1,506 | $225 | 1958 | 6 |
| Maplewood-Richmond Heights | 8 | 1,472 | $228 | 1929 | 4.5 |
| Valley Park | 6 | 1,437 | $226 | 1994 | 14.5 |
| Brentwood | 5 | 1,314 | $242 | 1940 | 12 |
| Kirkwood R-VII | 8 | 1,292 | $249 | 1948 | 11.5 |
Which St. Louis County school district gives you more house for $400,000?
Among homes that closed for $350,001 to $400,000 in 2026, Hazelwood gave the most house: a median of 3,016 square feet at $118 a square foot. The runner-up was Affton 101, at 2,501 square feet and $144. Kirkwood R-VII gave the least, 1,476 square feet at $253.
See the $400,000 table
| District | Sales | Median sq. ft. | Median $/sq. ft. | Median year built | Median CDOM |
|---|---|---|---|---|---|
| Hazelwood | 7 | 3,016 | $118 | 1988 | 22 |
| Affton 101 | 5 | 2,501 | $144 | 1960 | 6 |
| Pattonville | 13 | 2,345 | $169 | 1972 | 12 |
| Mehlville R-IX | 48 | 2,183 | $174 | 1978 | 23 |
| Parkway | 55 | 2,012 | $183 | 1970 | 4 |
| Lindbergh | 24 | 1,986 | $194 | 1963 | 6 |
| Rockwood R-VI | 30 | 1,828 | $204 | 1977 | 4.5 |
| Maplewood-Richmond Heights | 6 | 1,690 | $218 | 1934 | 4.5 |
| Webster Groves | 14 | 1,664 | $221 | 1950 | 12.5 |
| Kirkwood R-VII | 8 | 1,476 | $253 | 1948 | 4 |
Which St. Louis County school district gives you more house for $500,000?
Among homes that closed for $450,001 to $500,000 in 2026, Mehlville R-IX gave the most house: a median of 2,935 square feet at $161 a square foot. The runner-up was Parkway, at 2,787 square feet and $176. Webster Groves gave the least, 1,900 square feet at $262. The newest homes were in Rockwood R-VI, built 1988 on median.
See the $500,000 table
| District | Sales | Median sq. ft. | Median $/sq. ft. | Median year built | Median CDOM |
|---|---|---|---|---|---|
| Mehlville R-IX | 21 | 2,935 | $161 | 1987 | 10 |
| Parkway | 38 | 2,787 | $176 | 1974 | 7 |
| Rockwood R-VI | 32 | 2,558 | $183 | 1988 | 5 |
| Lindbergh | 7 | 2,174 | $214 | 1962 | 2 |
| Kirkwood R-VII | 17 | 1,971 | $254 | 1947 | 6 |
| Webster Groves | 9 | 1,900 | $262 | 1936 | 4 |
The district that gives you the most house changes with the budget, so start from your own number. The house tool above runs the same comparison for a specific size and layout.
Source: MARIS closed single-family sales in the 22 St. Louis County-area school districts, January 1–October 5, 2026: the same 2,868-sale QA-clean dataset used on this page (vacant or owner-occupied). Each budget compares homes that closed within $50,000 below it. Square footage is reported living area; condition and lot size aren’t part of the comparison.
Same House. Different District. Different Decision.
Let’s stop comparing a 1,000-square-foot bungalow in one district with a 3,000-square-foot two-story in another.
For this comparison, I narrowed the data to one specific kind of house:
3 bedrooms · 2 bathrooms · ranch · 1,300–1,500 square feet
That’s a practical way to approximate a buyer asking:
“What would a roughly 1,400-square-foot ranch cost in different school districts?”
The answer isn’t just a price.
It’s also how often that house showed up.
Lindbergh vs. Mehlville: What Did a Similar Ranch Cost?
In Lindbergh, 5 matching homes sold during the study period. The median sale price was $350,000.
In Mehlville, 18 matching homes sold. The median sale price was $277,000.
That’s a $73,000 difference in the median matching sale.
But price is only half the story.
The Mehlville dataset produced more than three times as many matching sales.
So a buyer choosing between these districts wasn’t only deciding whether Lindbergh was worth paying more for.
They were also deciding whether they were willing to shop from a smaller pool of houses that fit the same basic description.
What Did Buyers Pay per Square Foot for the Same Ranch?
The table below asks a simpler question than “what did a house cost?” It holds the style and size steady—ranch homes in two size ranges—and compares what buyers paid per square foot in each school district.
The same small ranch sold for a median of $298 a square foot in the Kirkwood School District and $231 in Mehlville R-IX. On a 1,200-square-foot house, that’s about $80,000 for the same basic house in a different district.
That gap is demand, and it shows up twice: in the price per square foot and in how quickly the house sold.
| District | Ranch Sales | Median Sold Price | Median $/Sq. Ft. | Median Year Built | Median CDOM | Sold Above Original List |
|---|---|---|---|---|---|---|
| Kirkwood R-VII | 6 | $306,194 | $298 | 1949 | 1.5 | 33.3% |
| Webster Groves | 14 | $290,000 | $268 | 1952 | 9 | 42.9% |
| Parkway | 13 | $300,000 | $256 | 1967 | 4 | 46.2% |
| Rockwood R-VI | 15 | $300,000 | $246 | 1971 | 4 | 66.7% |
| Lindbergh | 13 | $294,580 | $234 | 1956 | 11 | 53.8% |
| Mehlville R-IX | 23 | $265,000 | $231 | 1962 | 5 | 60.9% |
| Pattonville | 13 | $280,000 | $226 | 1966 | 7 | 61.5% |
| Affton 101 | 11 | $260,000 | $214 | 1951 | 13 | 54.5% |
| Bayless | 5 | $255,200 | $204 | 1954 | 4 | 60.0% |
| Valley Park | 6 | $229,000 | $178 | 1948 | 6.5 | 33.3% |
| Hazelwood | 56 | $168,950 | $146 | 1965 | 23 | 32.1% |
| Ritenour | 22 | $161,450 | $141 | 1953 | 22.5 | 27.3% |
| Ferguson-Florissant | 55 | $120,000 | $108 | 1955 | 32 | 20.0% |
| Riverview Gardens | 30 | $95,000 | $87 | 1954 | 24 | 20.0% |
| Jennings | 8 | $73,450 | $60 | 1956 | 61 | 37.5% |
Swipe the table sideways to see every column.
| District | Ranch Sales | Median Sold Price | Median $/Sq. Ft. | Median Year Built | Median CDOM | Sold Above Original List |
|---|---|---|---|---|---|---|
| Kirkwood R-VII | 6 | $365,000 | $235 | 1949 | 4.5 | 66.7% |
| Parkway | 29 | $375,000 | $228 | 1967 | 5 | 51.7% |
| Webster Groves | 8 | $351,250 | $219 | 1950 | 5.5 | 62.5% |
| Lindbergh | 22 | $347,500 | $216 | 1959 | 5 | 68.2% |
| Rockwood R-VI | 23 | $349,000 | $211 | 1969 | 3 | 52.2% |
| University City | 6 | $293,000 | $195 | 1954 | 19.5 | 66.7% |
| Mehlville R-IX | 48 | $304,175 | $194 | 1966 | 4 | 66.7% |
| Pattonville | 15 | $300,000 | $189 | 1966 | 8 | 60.0% |
| Affton 101 | 8 | $265,000 | $174 | 1954 | 29 | 62.5% |
| Bayless | 6 | $257,450 | $172 | 1961 | 15.5 | 50.0% |
| Hazelwood | 60 | $206,375 | $128 | 1964 | 14 | 45.0% |
| Ferguson-Florissant | 26 | $196,250 | $120 | 1957 | 28.5 | 23.1% |
| Ritenour | 9 | $190,000 | $112 | 1952 | 25 | 44.4% |
| Riverview Gardens | 9 | $137,000 | $87 | 1956 | 46 | 33.3% |
Swipe the table sideways to see every column.
Ranch style and size are held steady; condition is not, because MLS data doesn’t record it. Some groups are small (Kirkwood has 6 sales in each range), so read those medians as directional.
Districts with at least 5 matching ranch sales are shown. Price per square foot uses each listing’s reported living area.
What Did a Roughly 1,400-Square-Foot 3-Bed / 2-Bath Ranch Cost?
| District | Matching Sales | Median Sold Price | Median CDOM | Sold Above Original List |
|---|---|---|---|---|
| Ferguson-Florissant | 4 | $120,000 | 28 | 0% |
| Hazelwood | 15 | $220,000 | 18 | 20.0% |
| Bayless | 3 | $255,000 | 2 | 66.7% |
| Mehlville R-IX | 18 | $277,000 | 8 | 61.1% |
| Webster Groves | 3 | $285,000 | 10 | 33.3% |
| Rockwood R-VI | 3 | $339,500 | 31 | 33.3% |
| Parkway | 6 | $345,500 | 4 | 66.7% |
| Lindbergh | 5 | $350,000 | 9 | 80.0% |
Swipe the table sideways to see every column.
The count matters as much as the median.
Three matching sales and 18 matching sales are not the same buying experience.
A low count does not mean a buyer cannot purchase that kind of house in the district. It means that very few homes matching those exact criteria closed during the period we studied.
And a small sample also means the median price should be treated as directional rather than as a precise prediction of the next sale.
Competition metrics are historical signals, not promises about the next listing.
Your Budget Might Not Be the Problem
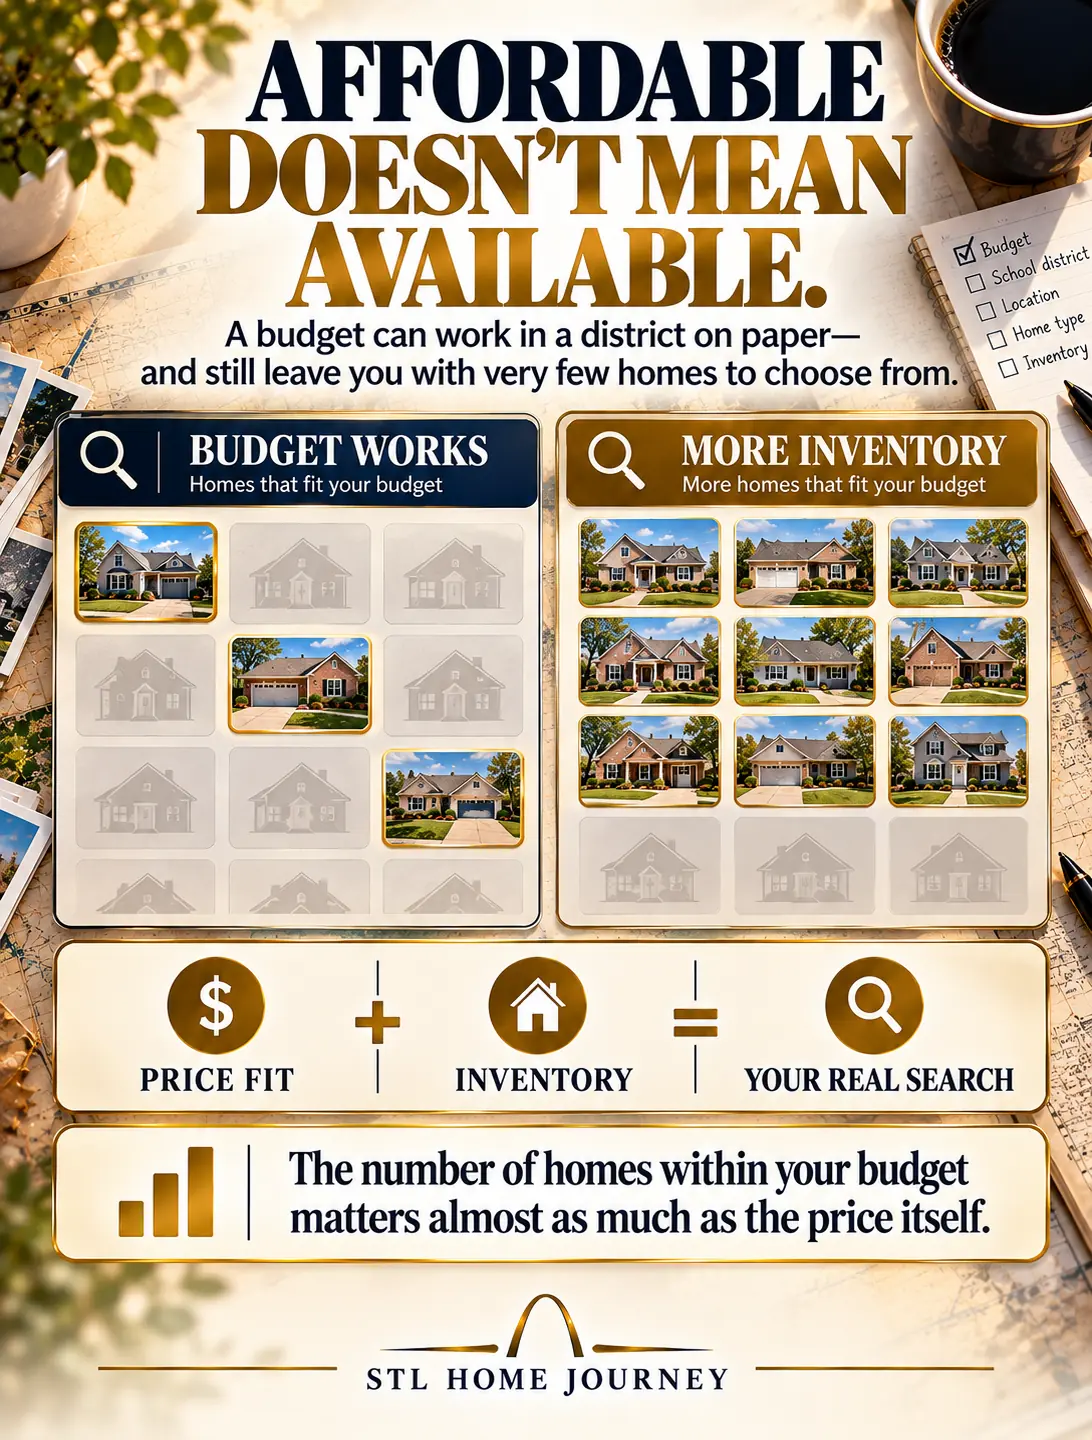
Sometimes buyers keep raising their budget because they assume price is why they can’t find the right house.
But what if the house itself is scarce?
If only three homes matching your criteria sold in a district during more than nine months of 2026, you could have enough money to buy one and still spend a long time waiting for the right opportunity.
That is a different problem than being priced out.
A price problem can sometimes be solved by changing the budget.
A scarcity problem usually forces a different decision:
change the district, change the house, or accept that the search may take longer.
If the Right House Finally Appears, Will Everyone Else Want It Too?
Scarcity and competition are related, but they are not the same thing.
A house type can be rare without every sale becoming a bidding war.
That’s why the tool also looks at days on market and sale price compared with original asking price.
For the roughly 1,400-square-foot 3-bed / 2-bath ranch cohort:
- Lindbergh had 5 matching sales, a 9-day median CDOM, and 80% sold above original list price.
- Mehlville had 18 matching sales, an 8-day median CDOM, and 61.1% sold above original list price.
- Parkway had 6 matching sales, a 4-day median CDOM, and 66.7% sold above original list price.
Those are small, highly specific cohorts, so don’t turn them into a prediction about the next house.
Use them for what they are:
evidence that price, availability and competition are three separate parts of the buying decision.
When Are Buyers Actually Shopping in St. Louis?
Buyer activity changes throughout the year. Spring often brings stronger demand, while late summer and fall can bring fewer showings. The pattern isn’t identical in every district.
A home that sold in April reflects the buyers who were competing when that contract was negotiated. Those same conditions may not exist when another homeowner lists in August.
Read the chart as a pattern, not a forecast. Showings count tours, not unique buyers—one buyer can tour several homes. Each district follows its own curve, and fewer showings in a month doesn’t by itself mean lower sale prices.
Monthly showings per listing for all 22 districts
| District | Jan | Feb | Mar | Apr | May | Jun | Jul | Aug | Sep |
|---|---|---|---|---|---|---|---|---|---|
| All 22 districts · market average | |||||||||
| Average of all 22 districts | 8.8 | 9.6 | 11.1 | 10.0 | 8.6 | 7.6 | 6.8 | 6.4 | 6.3 |
| South County · 3+ bedrooms · ≤$309,999 | |||||||||
| Affton 101 | 14.5 | 18.7 | 16.8 | 16.6 | 9.8 | 13.0 | 11.0 | 8.2 | 8.1 |
| Bayless | 14.9 | 13.6 | 21.0 | 13.7 | 12.1 | 8.3 | 8.3 | 9.8 | 12.4 |
| Mehlville R-IX | 12.5 | 13.1 | 11.3 | 12.4 | 10.6 | 10.7 | 8.6 | 9.6 | 10.4 |
| Lindbergh | 14.7 | 12.6 | 16.9 | 9.1 | 15.4 | 8.6 | 7.4 | 10.9 | 6.4 |
| West County · 3+ bedrooms · ≤$488,999 | |||||||||
| Parkway | 10.7 | 10.9 | 12.2 | 15.5 | 12.3 | 10.8 | 8.6 | 7.9 | 7.5 |
| Rockwood R-VI | 9.4 | 12.2 | 13.0 | 13.0 | 9.3 | 7.3 | 8.4 | 6.7 | 7.7 |
| Kirkwood R-VII | 10.0 | 12.1 | 15.9 | 15.5 | 8.9 | 11.1 | 10.2 | 7.2 | 8.8 |
| Webster Groves | 11.9 | 13.0 | 16.9 | 19.0 | 14.9 | 11.9 | 11.0 | 9.8 | 7.6 |
| Northwest County · 3+ bedrooms · $99,000–$249,999 | |||||||||
| Hazelwood | 7.0 | 7.4 | 8.3 | 7.5 | 6.9 | 6.0 | 6.1 | 5.8 | 4.8 |
| Ferguson-Florissant | 6.5 | 7.0 | 6.8 | 6.6 | 5.9 | 5.7 | 6.2 | 5.5 | 4.8 |
| Pattonville | 5.7 | 8.8 | 13.1 | 9.7 | 11.6 | 8.6 | 7.3 | 7.2 | 8.3 |
| Ritenour | 6.5 | 9.8 | 11.4 | 9.1 | 7.8 | 6.5 | 7.2 | 5.4 | 6.1 |
| North County · 3+ bedrooms · all prices | |||||||||
| Normandy | 4.3 | 3.9 | 6.1 | 4.2 | 4.3 | 4.0 | 3.9 | 4.6 | 3.9 |
| Jennings | 3.3 | 3.7 | 4.9 | 3.6 | 2.7 | 2.8 | 3.2 | 2.5 | 3.1 |
| Riverview Gardens | 3.6 | 4.3 | 4.4 | 3.8 | 3.1 | 2.2 | 2.9 | 3.0 | 3.0 |
| Hancock Place | 10.7 | 8.5 | 10.2 | 8.7 | 4.1 | 6.5 | 4.8 | 4.7 | 5.0 |
| Inner Ring · 2+ bedrooms · ≤$374,999 | |||||||||
| University City | 6.6 | 6.3 | 9.7 | 7.7 | 4.9 | 5.5 | 3.2 | 4.7 | 4.6 |
| Brentwood | 3.7 | 3.4 | 4.3 | 6.3 | 6.7 | 5.5 | 2.7 | 2.1 | 2.1 |
| Maplewood-Richmond Heights | 16.6 | 15.1 | 13.4 | 15.5 | 13.3 | 13.0 | 10.0 | 9.2 | 10.0 |
| Central County · 2+ bedrooms · ≤$999,999 | |||||||||
| Ladue | 8.0 | 12.9 | 14.8 | 11.0 | 10.6 | 9.3 | 7.9 | 8.5 | 6.6 |
| Clayton | 5.8 | 7.3 | 7.0 | 7.3 | 5.1 | 4.5 | 4.0 | 4.2 | 4.8 |
| Valley Park · 2+ bedrooms · $100,000–$299,999 | |||||||||
| Valley Park | 5.9 | 5.7 | 5.0 | 4.8 | 8.8 | 5.4 | 7.3 | 3.3 | 3.0 |
Source: STLHJ 2026 22-District Market Map, using MARIS InfoSparks Showings Per Listing for January–September 2026 (October is partial and excluded). Showings per listing is the average number of showings per listing in that month, as reported by InfoSparks for homes matching the district’s buyer filter. It uses selected property criteria, not every listing in the district, and it’s a separate measure from the 2,868 closed sales used elsewhere on this page. The monthly average is the simple average of the 22 district values for that month—a read on general direction, not a market-wide total, since each district uses its own filter. Parkway and Rockwood R-VI use the West County filter; Valley Park uses its own.
Did Prices Follow the Buyers?
Yes—a couple of months later. In this year’s St. Louis County-area sales, the median sale price climbed through spring, peaked in June at $379,500 and was $302,750 by September. Part of that drop is smaller homes selling later in the year: per square foot, prices went from $189 in June to $174 in July, August and September.
Buyer showings peaked in March and April (the chart above). Closings usually trail the contract by several weeks, so June’s closings largely reflect deals negotiated during that spring rush.
Read the two charts together. The median sale price shows what a typical home closed for that month. Price per square foot strips out some of the size difference, because bigger homes tend to sell in late spring and smaller ones later in the year.
Monthly medians also move with the mix of homes that close. April’s median ($310,000) came in below March’s ($350,000) because of which homes closed that month—price per square foot actually rose, from $175 to $181.
How Did Each School District’s Median Move in 2026?
One district’s monthly median moves far more than the county’s, because each month has far fewer sales behind it. In Parkway, the district with the most 2026 sales, the median ran from $360,000 in January to $555,000 in April, with 15 to 73 sales a month.
Pick a district to see its median sale price for each month, with the median for all 22 districts as a dashed line. Months with fewer than three sales are left blank, because one or two sales can’t make a median.
Monthly median price for every district
| District | Jan | Feb | Mar | Apr | May | Jun | Jul | Aug | Sep |
|---|---|---|---|---|---|---|---|---|---|
| All 22 districts | $280,000188 sales | $270,000191 sales | $350,000233 sales | $310,000339 sales | $364,500332 sales | $379,500468 sales | $334,000407 sales | $341,550372 sales | $302,750310 sales |
| Affton 101 | $248,00010 sales | —1 sale | $463,0004 sales | $253,50014 sales | $285,0007 sales | $292,4508 sales | $260,0007 sales | $287,50010 sales | $290,0005 sales |
| Bayless | —2 sales | —1 sale | —1 sale | $252,4008 sales | —2 sales | $234,5758 sales | $255,0003 sales | $229,2003 sales | $168,0003 sales |
| Brentwood | —2 sales | —1 sale | —2 sales | $400,0003 sales | —1 sale | $443,9006 sales | $328,2504 sales | $410,0005 sales | $378,5004 sales |
| Clayton | $1,475,0003 sales | —1 sale | $1,585,0003 sales | —1 sale | $915,0003 sales | $1,300,0005 sales | $1,294,5006 sales | $1,250,0005 sales | —2 sales |
| Ferguson-Florissant | $135,00021 sales | $143,50016 sales | $134,90019 sales | $139,20127 sales | $140,00021 sales | $125,00025 sales | $170,00031 sales | $147,50035 sales | $149,90035 sales |
| Hancock Place | $156,0003 sales | —1 sale | —2 sales | $172,0007 sales | $157,0004 sales | $165,5004 sales | $194,5004 sales | —1 sale | —1 sale |
| Hazelwood | $180,00023 sales | $180,00021 sales | $201,00023 sales | $194,90039 sales | $220,00037 sales | $192,00028 sales | $200,00053 sales | $225,50034 sales | $224,90037 sales |
| Jennings | $79,0004 sales | $68,9003 sales | —2 sales | $50,0003 sales | $73,0005 sales | $149,9007 sales | $153,9754 sales | $97,0008 sales | —1 sale |
| Kirkwood R-VII | $440,50010 sales | $431,4008 sales | $650,0005 sales | $521,50018 sales | $630,00021 sales | $635,00023 sales | $746,25022 sales | $490,00010 sales | $510,00013 sales |
| Ladue | $1,050,0005 sales | $500,0005 sales | $1,325,0007 sales | $1,302,0009 sales | $971,00014 sales | $856,00015 sales | $1,630,0007 sales | $1,057,50014 sales | $950,0005 sales |
| Lindbergh | $499,7024 sales | $263,0009 sales | $365,00012 sales | $407,50014 sales | $430,00017 sales | $390,00027 sales | $387,00023 sales | $421,20420 sales | $400,00017 sales |
| Maplewood-Richmond Heights | —1 sale | —2 sales | $251,4504 sales | —2 sales | $321,0003 sales | $355,0009 sales | $273,0007 sales | $334,2504 sales | —2 sales |
| Mehlville R-IX | $346,87216 sales | $399,90017 sales | $362,00020 sales | $330,00027 sales | $355,00032 sales | $370,00051 sales | $367,25044 sales | $351,50044 sales | $326,95030 sales |
| Normandy | $50,0005 sales | $73,0009 sales | $95,9003 sales | $65,0007 sales | $127,5006 sales | $105,00011 sales | $72,0009 sales | $121,2508 sales | $76,50010 sales |
| Parkway | $360,00015 sales | $400,00024 sales | $455,75036 sales | $555,00043 sales | $490,00045 sales | $499,00073 sales | $492,50059 sales | $510,00053 sales | $475,00049 sales |
| Pattonville | $303,5004 sales | $295,0004 sales | $305,00011 sales | $261,45018 sales | $340,5008 sales | $273,50024 sales | $292,00016 sales | $290,00013 sales | $315,0008 sales |
| Ritenour | $147,75012 sales | $175,00013 sales | $200,0005 sales | $135,00016 sales | $156,50011 sales | $175,00015 sales | $172,50016 sales | $153,75020 sales | $140,00015 sales |
| Riverview Gardens | $101,0007 sales | $90,0009 sales | $120,00013 sales | $121,50012 sales | $114,50010 sales | $96,02520 sales | $89,75018 sales | $75,5008 sales | $76,50017 sales |
| Rockwood R-VI | $608,00025 sales | $419,33824 sales | $515,00038 sales | $515,00041 sales | $550,00055 sales | $605,45064 sales | $515,00045 sales | $538,00053 sales | $528,70038 sales |
| University City | $435,0007 sales | $398,5006 sales | $762,50010 sales | $443,4007 sales | $350,00013 sales | $331,25016 sales | $196,00011 sales | $555,94412 sales | $504,5007 sales |
| Valley Park | —2 sales | $285,0005 sales | —1 sale | $285,0005 sales | —2 sales | $291,0003 sales | $400,0003 sales | $340,0005 sales | —1 sale |
| Webster Groves | $370,0007 sales | $355,00011 sales | $431,75012 sales | $363,00018 sales | $399,50015 sales | $502,50026 sales | $439,00015 sales | $435,0007 sales | $356,00010 sales |
Monthly prices and sales counts
| Closed in | Sales | Median price | Median sq. ft. | Median $/sq. ft. |
|---|---|---|---|---|
| January | 188 | $280,000 | 1,626 | $169 |
| February | 191 | $270,000 | 1,582 | $164 |
| March | 233 | $350,000 | 1,944 | $175 |
| April | 339 | $310,000 | 1,728 | $181 |
| May | 332 | $364,500 | 1,953 | $184 |
| June | 468 | $379,500 | 1,932 | $189 |
| July | 407 | $334,000 | 1,800 | $174 |
| August | 372 | $341,550 | 1,896 | $174 |
| September | 310 | $302,750 | 1,725 | $174 |
Source: MARIS closed single-family sales in the 22 St. Louis County-area school districts, the same 2,868-sale QA-clean dataset used on this page (vacant or owner-occupied), grouped by closing month. October is excluded; only 28 sales had closed by October 5. Historical sales, not current inventory or a forecast.
Is This Year’s Pattern Unusual?
No. Every year since 2016, St. Louis County’s median sale price has climbed from a winter low to a summer high, then eased back. In a typical year the swing is about 30%, and it has ranged from 22% to 52%, in the low-rate years before COVID and in the higher-rate years since.
The sharpest round trip came in 2023 and 2024: $280,000 in June 2023, $200,000 in January 2024 and $304,295 by June 2024. A buyer and a seller looking at the same county six months apart saw very different numbers.
Part of every swing is which homes sell when. Larger, higher-priced homes tend to close in late spring and summer. Even so, the pattern has repeated every year in this data.
Where prices are likely headed
The dashed line projects the next 12 months. It takes each month’s median from a year earlier and adjusts it for the past year’s growth (5.8%). The shaded band is the range this method hit 80% of the time when it was tested against 2021–2026 sales.
If the pattern holds, expect a winter low around $270,000 in January 2027 (likely $242,000–$290,000) and summer prices near $340,000 by June 2027 (likely $308,000–$368,000). A sudden shift in the market can push prices outside that band. The projection is updated as new months close.
These are MARIS’s county-wide medians from InfoSparks, a different set of sales from the qualifying single-family sales in 22 districts used elsewhere on this page. That’s why June 2026 shows $325,000 here and $379,500 in the chart above.
Each year’s low, high and swing
| Year | Lowest month | Highest month | Swing |
|---|---|---|---|
| 2016 | February $147,000 | June $205,000 | +39.5% |
| 2017 | February $149,950 | July $198,000 | +32.0% |
| 2018 | January $160,000 | June $210,000 | +31.2% |
| 2019 | February $165,000 | June $232,750 | +41.1% |
| 2020 | February $172,750 | August $238,000 | +37.8% |
| 2021 | January $205,000 | July $250,000 | +22.0% |
| 2022 | February $210,000 | June $275,000 | +31.0% |
| 2023 | January $215,000 | June $280,000 | +30.2% |
| 2024 | January $200,000 | June $304,295 | +52.1% |
| 2025 | January $230,500 | June $305,000 | +32.3% |
| 2026 (Jan–Sep) | January $251,551 | June $325,000 | +29.2% |
Month-by-month projection
| Month | Projection | Likely range | A year earlier |
|---|---|---|---|
| October 2026 | $301,000 | $277,000–$321,000 | $290,500 |
| November 2026 | $284,000 | $258,000–$302,000 | $260,500 |
| December 2026 | $274,000 | $248,000–$293,000 | $262,500 |
| January 2027 | $270,000 | $242,000–$290,000 | $251,551 |
| February 2027 | $274,000 | $245,000–$297,000 | $254,500 |
| March 2027 | $289,000 | $258,000–$315,000 | $276,500 |
| April 2027 | $306,000 | $275,000–$333,000 | $285,000 |
| May 2027 | $326,000 | $293,000–$357,000 | $310,916 |
| June 2027 | $339,000 | $308,000–$368,000 | $325,000 |
| July 2027 | $341,000 | $309,000–$372,000 | $320,000 |
| August 2027 | $340,000 | $310,000–$369,000 | $325,000 |
| September 2027 | $333,000 | $300,000–$368,000 | $315,000 |
Source: MARIS® median sales price, St. Louis County, monthly, January 2016 to September 2026 (InfoSparks© 2026 ShowingTime, data as of October 9, 2026). Projections are estimates based on past seasonal patterns, not a guarantee of future prices.
What Happens If I Add Another $50,000 to My Budget?
Sometimes another $50,000 barely changes the search.
Sometimes it changes everything.
A few examples from the 2026 closed-sale data:
- Affton: At $250,000, 23 of 67 sales (34.3%) were within budget. At $300,000, 50 sales (74.6%) were within budget.
- Pattonville: $250,000 reached 31 of 108 sales (28.7%). $300,000 reached 63 sales (58.3%).
- Mehlville: $300,000 reached 83 of 285 sales (29.1%). $350,000 reached 143 sales (50.2%).
- Lindbergh: $300,000 reached 32 of 146 sales (21.9%). $350,000 reached 52 sales (35.6%).
- Parkway: $300,000 reached 24 of 399 sales (6.0%). $350,000 reached 74 sales (18.5%).
The point isn’t that you should automatically spend another $50,000.
It’s to understand what the extra money actually buys you.
If another $50,000 barely changes your options, stretching may not solve the problem you think it will.
If it opens a much larger part of the market, at least you can see the tradeoff before deciding whether the higher payment is worth it.
Which St. Louis County School Districts Had the Cheapest Homes in 2026?
If “cheapest” means the lowest median closed single-family home price in this specific 2026 dataset, the lowest-price districts were:
| District | QA-Clean Sales | Median Sold Price |
|---|---|---|
| Normandy | 69 | $80,000 |
| Jennings | 37 | $88,000 |
| Riverview Gardens | 115 | $92,000 |
| Ferguson-Florissant | 232 | $141,000 |
| Ritenour | 124 | $156,103 |
| Hancock Place | 27 | $156,500 |
| Hazelwood | 296 | $200,750 |
That is a housing-price comparison.
It is not a ranking of school quality, desirability, safety, or where anyone should live.
It also doesn’t mean every house in a lower-median district is comparable with every house in a higher-median district. Condition, size, age, location and housing stock can be very different.
That’s why the interactive lets you move beyond the district median and compare the kind of house you actually want.
How Much of Each District Was Within Your Budget?
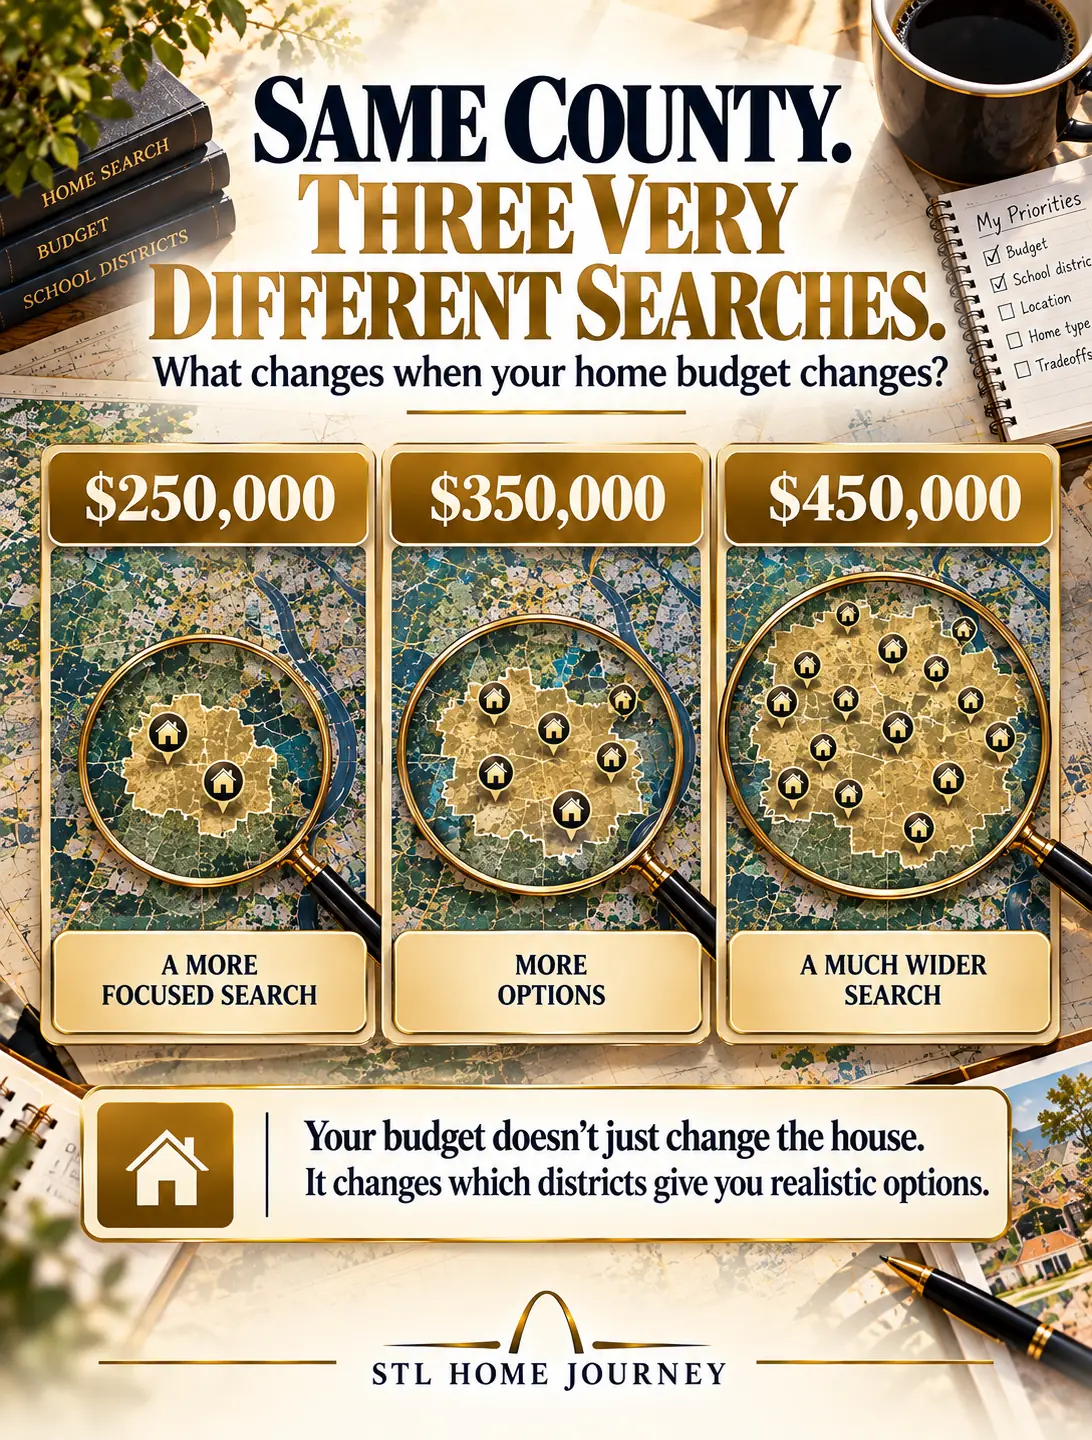
Percentages mean:
Share of QA-clean 2026 closed single-family sales in that district that sold at or below the stated price.
| District | Sales | Median | ≤$200K | ≤$250K | ≤$300K | ≤$350K | ≤$400K | ≤$500K |
|---|---|---|---|---|---|---|---|---|
| Affton 101 | 67 | $270,000 | 6.0% | 34.3% | 74.6% | 80.6% | 88.1% | 95.5% |
| Bayless | 31 | $254,799 | 22.6% | 48.4% | 87.1% | 93.5% | 96.8% | 100% |
| Brentwood | 28 | $401,000 | 0% | 7.1% | 17.9% | 35.7% | 50.0% | 75.0% |
| Clayton | 29 | $1,250,000 | 0% | 0% | 0% | 0% | 0% | 0% |
| Ferguson-Florissant | 232 | $141,000 | 75.9% | 90.9% | 97.8% | 99.6% | 100% | 100% |
| Hancock Place | 27 | $156,500 | 77.8% | 92.6% | 100% | 100% | 100% | 100% |
| Hazelwood | 296 | $200,750 | 49.7% | 75.3% | 90.5% | 94.9% | 97.3% | 100% |
| Jennings | 37 | $88,000 | 94.6% | 100% | 100% | 100% | 100% | 100% |
| Kirkwood R-VII | 133 | $575,000 | 0.8% | 1.5% | 9.0% | 15.0% | 21.1% | 40.6% |
| Ladue | 82 | $1,028,500 | 0% | 0% | 1.2% | 4.9% | 6.1% | 12.2% |
| Lindbergh | 146 | $400,000 | 3.4% | 6.8% | 21.9% | 35.6% | 52.1% | 69.9% |
| Maplewood-Richmond Heights | 35 | $325,000 | 5.7% | 17.1% | 37.1% | 60.0% | 77.1% | 82.9% |
| Mehlville R-IX | 285 | $350,000 | 2.8% | 13.3% | 29.1% | 50.2% | 67.0% | 84.2% |
| Normandy | 69 | $80,000 | 94.2% | 94.2% | 95.7% | 97.1% | 98.6% | 100% |
| Parkway | 399 | $490,000 | 0.5% | 2.0% | 6.0% | 18.5% | 32.3% | 53.1% |
| Pattonville | 108 | $285,000 | 12.0% | 28.7% | 58.3% | 79.6% | 91.7% | 97.2% |
| Ritenour | 124 | $156,103 | 79.8% | 97.6% | 100% | 100% | 100% | 100% |
| Riverview Gardens | 115 | $92,000 | 99.1% | 99.1% | 100% | 100% | 100% | 100% |
| Rockwood R-VI | 388 | $529,000 | 1.5% | 3.6% | 8.0% | 16.5% | 24.2% | 43.6% |
| University City | 89 | $443,400 | 25.8% | 31.5% | 34.8% | 43.8% | 46.1% | 55.1% |
| Valley Park | 27 | $313,000 | 11.1% | 29.6% | 48.1% | 70.4% | 85.2% | 96.3% |
| Webster Groves | 121 | $425,000 | 2.5% | 7.4% | 24.8% | 35.5% | 47.1% | 65.3% |
Swipe the table sideways to see every price level.
A percentage is more useful than a simple yes or no.
If 6% of a district’s sales were within your budget, homes at that price existed—but you were shopping a very different market than someone whose budget reached 75% of the district’s sales.
And none of these percentages tell you what’s listed today.
They tell you where your budget sat inside the market buyers actually closed on during the study period.
See what a sub-$1M search actually looked like in Clayton vs. Ladue.
How much are property taxes in St. Louis County school districts?
Updated October 2026 · MLS sales records
Across the 22 St. Louis County-area school districts, the median annual property tax on homes sold in 2026 was $3,624, according to MLS sales records. District medians ranged from $1,446 to $11,638, across 2,856 sales from January 1 to October 5, 2026.
The bill follows the county’s assessed value and the local tax rates, not the price the house sold for. That is why the table below lists each district’s typical bill rather than a tax rate.
See all 22 districts
| District | Sales | Median tax | Middle half |
|---|---|---|---|
| Affton 101 | 67 | $3,098 | $2,789– |
| Bayless | 31 | $2,610 | $2,315– |
| Brentwood | 28 | $4,130 | $3,431– |
| Clayton | 28 | $11,638 | $9,848– |
| Ferguson-Florissant | 231 | $1,793 | $1,416– |
| Hancock Place | 26 | $1,994 | $1,801– |
| Hazelwood | 295 | $2,838 | $2,324– |
| Jennings | 38 | $1,718 | $1,273– |
| Kirkwood R-VII | 132 | $5,491 | $4,174– |
| Ladue | 81 | $10,055 | $6,900– |
| Lindbergh | 146 | $4,048 | $3,122– |
| Maplewood-Richmond Heights | 35 | $4,049 | $3,472– |
| Mehlville R-IX | 283 | $3,429 | $2,822– |
| Normandy | 72 | $1,446 | $1,110– |
| Parkway | 398 | $4,763 | $3,862– |
| Pattonville | 108 | $3,272 | $2,895– |
| Ritenour | 124 | $2,016 | $1,706– |
| Riverview Gardens | 115 | $1,704 | $1,386– |
| Rockwood R-VI | 385 | $5,793 | $4,509– |
| University City | 87 | $5,021 | $2,363– |
| Valley Park | 27 | $3,794 | $2,918– |
| Webster Groves | 119 | $4,515 | $3,488– |
How much are property taxes on a $300,000 house in St. Louis County?
For homes that sold for $250,000 to $349,999 in 2026, the median annual property tax was $3,261, and the middle half of bills ran from $2,869 to $3,700, according to MLS sales records across 22 St. Louis County-area school districts.
See every price range
| Sale price | Sales | Median tax | Middle half |
|---|---|---|---|
| Under $150,000 | 471 | $1,668 | $1,368– |
| $150,000–$249,999 | 495 | $2,522 | $2,101– |
| $250,000–$349,999 | 543 | $3,261 | $2,869– |
| $350,000–$499,999 | 561 | $4,324 | $3,827– |
| $500,000–$749,999 | 433 | $6,015 | $5,287– |
| $750,000–$999,999 | 158 | $8,370 | $7,244– |
| $1,000,000+ | 195 | $12,223 | $10,526– |
Which St. Louis County school districts have lower or higher property taxes on the same size house?
For homes of 1,500–1,999 square feet, the median annual property tax ranged from $1,850 in Jennings to $5,860 in Ladue, among the 20 districts with at least five such sales in 2026, according to MLS sales records.
Comparing the same size house matters because a district with bigger or newer homes will show a higher median bill even if similar houses are taxed about the same.
See every district
| District | 1,000–1,499 sq ft | 1,500–1,999 sq ft |
|---|---|---|
| Affton 101 | $2,848 (22) | $3,246 (14) |
| Bayless | $2,510 (16) | $2,895 (6) |
| Brentwood | $3,522 (6) | $4,056 (8) |
| Clayton | — | — |
| Ferguson-Florissant | $1,684 (97) | $2,384 (42) |
| Hancock Place | $2,309 (12) | — |
| Hazelwood | $2,560 (108) | $3,031 (93) |
| Jennings | $1,694 (18) | $1,850 (6) |
| Kirkwood R-VII | $3,518 (16) | $4,950 (30) |
| Ladue | — | $5,860 (8) |
| Lindbergh | $3,143 (26) | $3,460 (37) |
| Maplewood-Richmond Heights | $3,736 (12) | $4,848 (12) |
| Mehlville R-IX | $2,705 (49) | $3,147 (79) |
| Normandy | $1,799 (17) | $2,694 (8) |
| Parkway | $3,297 (32) | $3,772 (74) |
| Pattonville | $3,052 (30) | $3,476 (39) |
| Ritenour | $2,021 (53) | $2,179 (14) |
| Riverview Gardens | $2,024 (50) | $1,870 (8) |
| Rockwood R-VI | $3,436 (28) | $4,037 (56) |
| University City | $1,943 (23) | $4,602 (13) |
| Valley Park | $3,401 (11) | $4,037 (6) |
| Webster Groves | $3,621 (33) | $3,957 (25) |
Source: MLS sales records (MARIS), single-family homes closed January 1–October 5, 2026. The tax figure is the seller’s most recent annual bill as listed in MLS. Taxes can change after a sale, so confirm the current bill with the St. Louis County Collector of Revenue. District pages break taxes down by bedrooms, square footage and nearby districts.
A Median Price Can Hide the Search You’re Actually Going to Have
University City is a good example.
Its median sale price in this dataset was $443,400.
But 31.5% of its qualifying sales still closed for $250,000 or less.
That doesn’t mean a $250,000 buyer had access to the same houses as a $443,000 buyer.
It means a single median number can hide a wide distribution of housing condition, size, location and price.
That’s why this page shows both:
where the middle of the district landed and how much of the market actually fell below your budget.
What Are You Willing to Change?
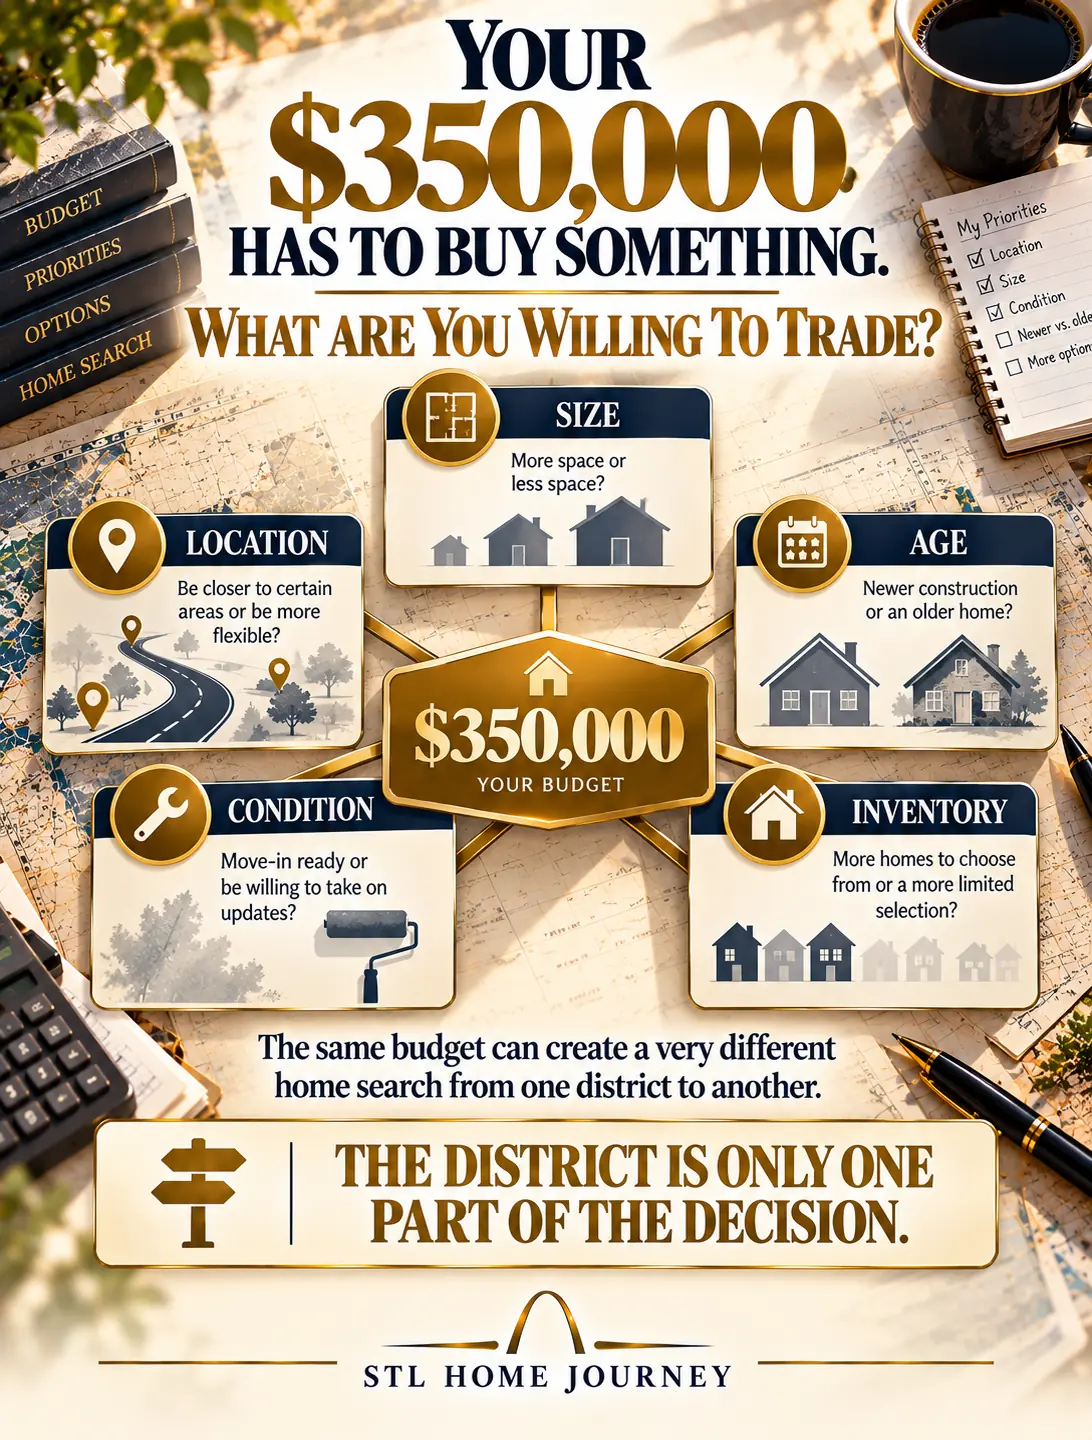
When the house you want doesn’t fit the district you want, there are only a few levers to pull.
You can spend more.
You can accept a different kind of house.
You can broaden the district.
Or you can wait.
The hard part is knowing which compromise actually changes your options.
The interactive should help answer that.
If changing the budget from $300,000 to $350,000 adds dozens of historical matches, that’s useful.
If adding $50,000 barely changes the search but broadening the square-footage range or crossing a district line changes it dramatically, that’s useful too.
The goal isn’t to push you toward the most expensive option.
It’s to show you what each decision buys you before you make it.
Before You Fall in Love With the House, Verify the Address
School-district boundaries in St. Louis County do not follow city names, ZIP codes or neighborhood labels cleanly.
A listing can say “Crestwood,” “Florissant,” “Ballwin” or “St. Louis” without that city name settling the school-district question.
And MLS school fields can be wrong.
During QA for this project, obvious district-assignment errors had to be corrected before the housing metrics were regenerated.
So use this page to compare housing markets.
When a specific school assignment matters to your purchase, verify the exact address directly with the school district before you write an offer.
How I Built This
I started with district-specific MARIS searches for closed single-family homes from January 1 through October 5, 2026.
The source searches were limited to properties identified as vacant or owner occupied.
Then I ran a separate QA pass before using the data for this page.
Five records were removed because the public remarks explicitly showed a current tenant or current lease.
Three obvious school-district misassignments were corrected after geography review.
The final dataset contains 2,868 qualifying closed sales across 22 St. Louis County-area school districts.
For property taxes, I pulled a second set of district-specific MARIS exports that include each listing’s annual tax amount and matched them to this dataset by address, close date and price. 2,856 of the 2,868 sales matched with a tax amount. The tax is the seller’s most recent annual bill as listed in MLS, not a projection of the next owner’s bill.

How the numbers work
Median sold price is the middle Close Price in the district.
25th percentile is used as a more stable lower-market reference than the single cheapest sale.
Budget share is the percentage of qualifying district sales that closed at or below the selected budget.
Comparable-house analysis uses the actual house characteristics in the dataset rather than estimating a price by multiplying a district-wide price per square foot.
The default “roughly 1,400-square-foot ranch” comparison means:
exactly 3 bedrooms · exactly 2 bathrooms · Ranch architectural style · 1,300–1,500 square feet
Days on market uses CDOM from the source data.
Sold above original asking compares Close Price with Original List Price.
Percentiles in the interactive (25th, 75th and the middle 50%) use linear interpolation between ranked sale prices, the same method as Excel’s PERCENTILE.INC.
What this data cannot tell you
This is historical closed-sale data.
It does not show today’s active inventory.
It does not guarantee that a similar house will become available.
It does not predict how long you personally will wait.
It does not determine whether a school district or individual school is right for you.
And it does not replace address-level school-boundary verification.
Source: MARIS district-specific closed-sale exports supplied by George Kindler. Analysis covers 2,868 QA-clean single-family sales from January 1 through October 5, 2026. Historical sales are not current inventory. School assignment must be verified by exact property address.
School District Housing Questions Buyers Actually Ask

What is the best school district in St. Louis County?
There isn’t one school district that is “best” for every buyer, and this page does not rank districts by school quality.
If schools matter to your decision, research the individual schools, programs and current official performance information that matter to you.
What I can show you here is the housing tradeoff: what homes cost, how much of a district fell within your budget, what kind of house your money bought, and how often that house actually sold.
Which St. Louis County school districts had the cheapest homes in 2026?
By median closed single-family sale price in this dataset, the lowest-price districts were Normandy, Jennings, Riverview Gardens, Ferguson-Florissant, Ritenour, Hancock Place and Hazelwood.
That is a housing-price comparison, not a ranking of the schools or communities.
Can I buy a house in Lindbergh School District for $250,000?
Yes, but it was historically uncommon in the period studied.
Ten of 146 qualifying Lindbergh sales closed for $250,000 or less—6.8% of the district’s sales in the dataset.
At $300,000, the share increased to 21.9%. At $400,000, it reached 52.1%.
How much did a roughly 1,400-square-foot ranch cost in Lindbergh?
For the default comparable-home cohort—3 bedrooms, 2 bathrooms, ranch style and 1,300–1,500 square feet—five Lindbergh homes matched.
Their median sale price was $350,000.
Because five sales is a small comparison group, use that price together with the count rather than treating $350,000 as a prediction of the next sale.
How did a similar ranch compare in Mehlville?
The same 3-bedroom, 2-bath, 1,300–1,500-square-foot ranch search produced 18 Mehlville sales with a $277,000 median.
The important difference was not only the lower median price.
There were also substantially more matching sales in the Mehlville data than in Lindbergh.
Does a low number of matching sales mean I’ll have to wait months?
No.
Historical sale count is not a forecast of the next listing.
A low count tells you that relatively few homes matching those criteria closed during the study period. That is useful evidence of scarcity, but it cannot tell you when the next matching house will come to market.
Does this St. Louis County page show homes for sale right now?
No.
This page analyzes closed sales from January 1 through October 5, 2026.
Current inventory changes every day.
The historical data is meant to answer a different question: whether your budget and house preferences were common or unusual in the market buyers actually purchased.
Are St. Louis County school-district boundaries the same as city or ZIP-code boundaries?
No.
School-district boundaries can cross cities, neighborhoods and ZIP codes. Verify the assigned schools for any serious property directly with the school district before making a school-driven purchase decision.
Keep Researching the District—Not Just the Price
The tool above answers the housing question.
The individual district guides go deeper into boundaries, communities, school structure, official research sources and the things buyers should verify before making an offer.
The 2026 housing dataset on this page covers 22 St. Louis County-area districts. Additional St. Louis-area district guides remain available below even when they are not part of this specific housing dataset.
Districts in the 2026 St. Louis County dataset
Other St. Louis-area district guides
Know What You’re Trading Before You Change Your Search
Maybe the district is non-negotiable.
Maybe the ranch is.
Maybe keeping the payment below a certain number matters more than either one.
There isn’t a universal right answer.
But there is a difference between making a compromise because you understand the market and making one because you’ve spent three months refreshing listings and nothing seems to fit.
If you want to compare your actual budget, the kind of house you’re trying to buy and the districts you’re considering, ask me.
I’ll tell you what I see in the numbers—and where I’d widen the search first.