
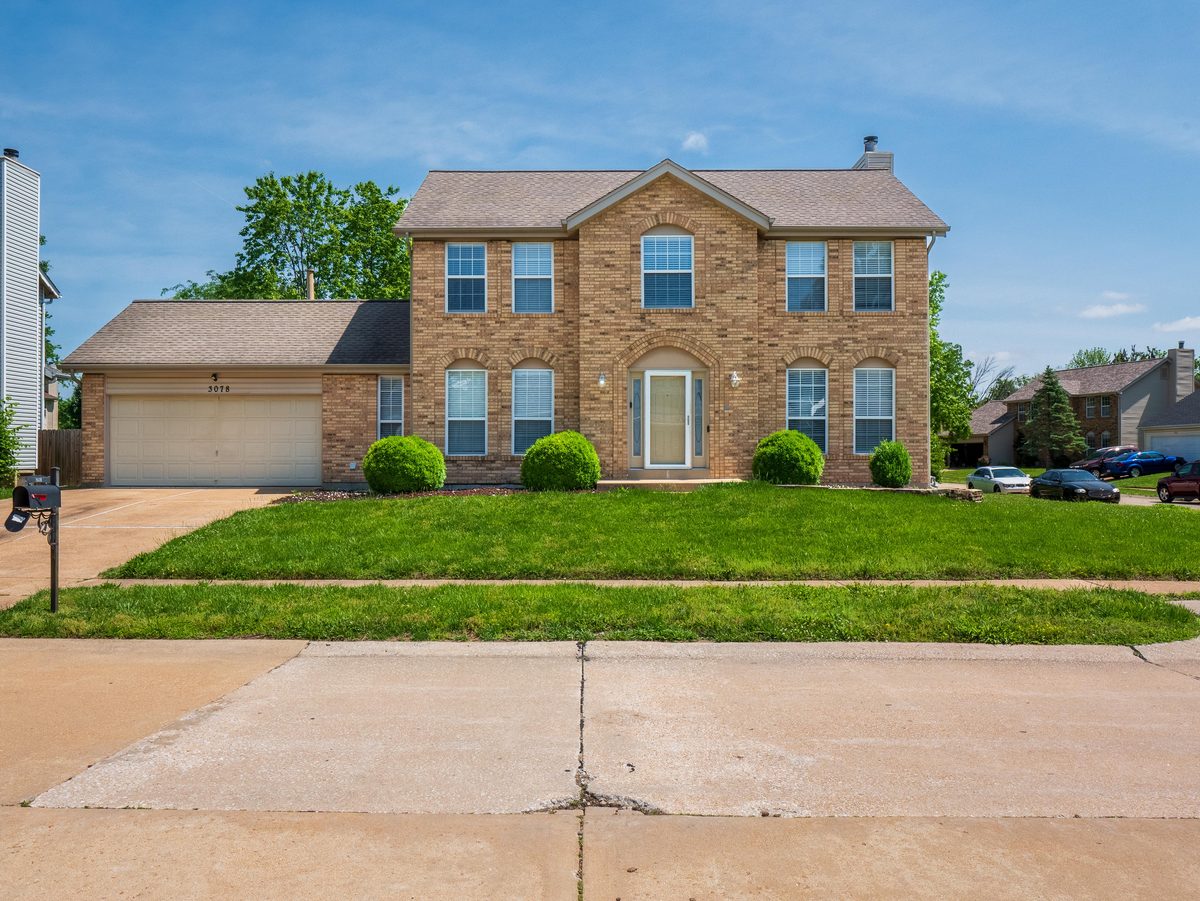
Buying a House in Florissant, Missouri
Florissant gives buyers a realistic North County option: established neighborhoods, a more grounded monthly number, and a location that still works for day-to-day life.
Florissant Home Buying Questions, Answered With 2026 Sales
Short answers first. Each one links to the sales behind it further down the page.
How much do houses cost in Florissant, Missouri?
In 167 sales inside the City of Florissant’s Census boundary that closed between January 6 and October 1, 2026, the median sale price was $180,000. The middle half sold between $149,900 and $225,000, and the full range ran from $62,400 to $410,000.
Can I buy a house in Florissant for $150,000?
46 of 167 sales (27.5%) closed at $150,000 or less. Of those 46, 31 had three or more bedrooms, 20 had two or more baths and 28 were ranch-style. Their median was 1,030.5 sq ft, built in 1954.
What does $200,000 buy in Florissant?
107 of 167 sales (64.1%) closed at $200,000 or less. Of those 107, 90 had three or more bedrooms, 65 had two or more baths and 70 were ranch-style. Their median was 1,092 sq ft, built in 1956.
How fast do houses sell in Florissant?
The median sale spent 27 days on market (CDOM). A quarter of the 167 sales took 7 days or less; the slowest quarter took about 51 days or more. 78 sales took 30+ days, 36 took 60+ and the longest took 337.
Do Florissant homes sell over asking?
Measured against the original list price, 57 of 167 (34.1%) closed above it, 26 (15.6%) at it and 84 (50.3%) below it. The median sale was 99.7% of the original ask.
See asking-price results by band → · How much should you offer? →
What kind of houses are common in Florissant?
Almost entirely houses built before 1980. Of the 167 sales, 100 (59.9%) were built before 1960, 63 (37.7%) from 1960 to 1979, 2 (1.2%) from 1980 to 1999 and 2 (1.2%) in 2000 or later. The median house was about 1,300 sq ft, built in 1958, and 107 of 167 (64.1%) listed a ranch style.
Does a Florissant mailing address mean the house is in the City of Florissant?
Not necessarily. The 167 sales inside the city boundary were in 63031 (117) and 63033 (50), and ZIP codes don’t follow city limits. 164 of the 167 listed “Florissant” as the city in MLS. Check the St. Louis County GIS map for the exact address.
Which school district is Florissant in?
Two. Of the 167 sales inside the city boundary, 90 were in the Ferguson-Florissant School District and 77 in the Hazelwood School District. Houses a few streets apart can be in different districts. Verify the assigned schools for the exact address before you write an offer.
How much are property taxes in Florissant?
It depends on which school district side of Florissant the house is on. In 2026 sales inside the City of Florissant’s Census boundary, the median annual property tax was $2,105 on the Ferguson-Florissant side (about 1.22% of the sale price) and $2,653 on the Hazelwood side (about 1.41% of the sale price). The tax on a listing is the seller’s most recent bill, so use these medians to compare areas, then confirm the exact address with the St. Louis County Collector of Revenue before you make an offer.
Ferguson-Florissant property taxes → · Hazelwood property taxes →
How do Ferguson-Florissant-side prices compare with the Hazelwood side of Florissant?
Nearly the same: a $175,000 median across 90 sales on the Ferguson-Florissant side versus $182,000 across 77 on the Hazelwood side. The houses were similar too (1,300 vs. 1,321 sq ft), and so was price per square foot ($135 vs. $139). The difference was speed: Hazelwood-side homes had a 15-day median market time versus 29.
Is Florissant its own city?
Yes. Florissant is an incorporated city in St. Louis County with its own city government. Before you close, ask the city what it requires when a house changes hands, such as an occupancy permit or inspection.
Source: 167 closed sales inside the City of Florissant’s Census boundary, January 6–October 1, 2026. Location from each listing’s map coordinates against the Census Bureau’s 2024 boundary. Historical sales, not current inventory.
What Does Your Money Actually Buy in Florissant?
Most neighborhood guides describe how an area feels. This section shows what actually sold.
I counted 167 closed 2026 sales whose map location falls inside the Census Bureau’s boundary for the City of Florissant. That’s the definition used on this page, not every 63031 or 63033 address.
Sold prices ran from $62,400 to $410,000, and the median original list price was $184,900. The typical house had 3 bedrooms and 2 bathrooms and was built in 1958.
What Your Budget Reached in Florissant
A preapproval tells you what a lender will allow. This shows how much of the Florissant market actually closed at or below each number.
$175,000 reached 77 of 167 sales, and $200,000 reached 107, nearly two-thirds of the market. Above $250,000, only 17 sales remained.
Budget counts include sales exactly at each threshold. This is historical closed-sale data, not today’s inventory.
Florissant by Price Band
Each row is a slice of the same 167 sales. Read the sale count before the median.
| Price band | Sales | Median sold | Median CDOM | Median sq ft | Median sale ÷ original ask |
|---|---|---|---|---|---|
| Under $150K | 43 | $136,500 | 25 | 1,040 | 96.0% |
| $150K–$199,999 | 60 | $175,000 | 32.5 | 1,183 | 99.6% |
| $200K–$249,999 | 47 | $225,000 | 15 | 1,650 | 100.0% |
| $250K+ | 17 | $275,000 | 28 | 1,752 | 100.8% |
The $250K+ band has 17 sales; the other bands have 43 to 60.
What Changes When You Add $25,000?
| Budget | Sales at or below | Share of sales | Change from previous step |
|---|---|---|---|
| $125,000 | 15 | 9.0% | — |
| $150,000 | 46 | 27.5% | +18.6 points |
| $175,000 | 77 | 46.1% | +18.6 points |
| $200,000 | 107 | 64.1% | +18.0 points |
| $225,000 | 128 | 76.6% | +12.6 points |
| $250,000 | 150 | 89.8% | +13.2 points |
The steps from $150,000 to $175,000 and from $175,000 to $200,000 each added about 18 points. That $50,000 window held 61 of the 167 sales.
The House Changes Too
| Price band | Beds | Baths | Sq ft | Year built | Ranch share |
|---|---|---|---|---|---|
| Under $150K | 3 | 1 | 1,040 | 1954 | 60.5% |
| $150K–$199,999 | 3 | 2 | 1,183 | 1958 | 68.3% |
| $200K–$249,999 | 3 | 2 | 1,650 | 1959 | 63.8% |
| $250K+ | 4 | 3 | 1,752 | 1963 | 58.8% |
Under $150,000, the typical sale was a 3-bedroom, 1-bath house of about 1,040 sq ft built around 1954. From $200,000 to $249,999, the median house grew to 1,650 sq ft with two baths.
How Quickly Did Florissant Homes Actually Sell?
| Price band | Median | Middle half (25th–75th) | Longest |
|---|---|---|---|
| Under $150K | 25 | 8–59.5 | 145 |
| $150K–$199,999 | 32.5 | 8.8–62.5 | 337 |
| $200K–$249,999 | 15 | 3–51 | 147 |
| $250K+ | 28 | 8–41 | 45 |
The median sale took 27 days, and 78 of 167 took 30 days or more. The $200K–$249,999 band was the quickest, at a 15-day median.
Did Florissant Sellers Get Their Original Asking Price?
| Price band | Above | At | Below | Median sale ÷ original ask |
|---|---|---|---|---|
| Under $150K | 11 | 3 | 29 | 96.0% |
| $150K–$199,999 | 17 | 12 | 31 | 99.6% |
| $200K–$249,999 | 19 | 9 | 19 | 100.0% |
| $250K+ | 10 | 2 | 5 | 100.8% |
More sales closed below the original ask (84) than above it (57). Under $150,000, 29 of 43 sold below the original ask, and the median sale was 96.0% of it.
Original asking price reflects each seller’s pricing decision, so this isn’t an offer formula.
How This Florissant Analysis Was Built
This analysis uses 167 closed-sale records from the STL Home Journey 2026 St. Louis County sales dataset (January 6–October 1, 2026). A sale counts here when its listing’s map coordinates fall inside the Census Bureau’s boundary for the City of Florissant, using the U.S. Census Bureau’s 2024 TIGER/Line place boundary. The same records feed the St. Louis County school district housing analysis.
- Historical closed sales are not current inventory.
- Days on market uses CDOM.
- Sale ÷ original ask compares the close price with the original list price.
- Ranch share counts any MLS style that includes “Ranch.”
- Listing coordinates can be imprecise near the boundary. Verify jurisdiction and school assignment for the exact address.
Schools in Florissant
Florissant crosses a school district line, and the 2026 sales show it. Of the 167 sales inside the city boundary, 90 were in the Ferguson-Florissant School District and 77 in the Hazelwood School District. Two houses a few streets apart can have different school assignments. If the district matters to your decision, confirm it for the exact address before you schedule a showing.
Comparing the districts. Inside Florissant, the two districts sold at nearly the same prices for similar houses. Hazelwood-side homes sold faster.
| Area | Sales | Median sold | Median sq ft | Median year built | Median $/sq ft | Median CDOM |
|---|---|---|---|---|---|---|
| Ferguson-Florissant (McCluer North / McCluer) | 90 | $175,000 | 1,300 | 1956 | $135 | 29 |
| Hazelwood (Hazelwood West / Central / East) | 77 | $182,000 | 1,321 | 1960 | $139 | 15 |
⚠ School boundaries can vary by exact property address. Verify assigned schools directly with the district, county records, or your buyer agent before writing an offer.
Fixer Upper vs. Move-In Ready
School district confirmed. Now the real question — what does your budget actually buy here on both paths? The comparison tool shows which St. Louis neighborhoods offer a genuinely equivalent home within 5% of the same total cost. FHA, VA, and conventional math included.
What Buyers Actually Need to Understand
Florissant works best for buyers who understand what it is. It is one of North County's largest and most recognizable municipalities, with broad housing choice and strong everyday convenience. That matters because people who shop this market usually are not buying a headline; they are buying fit, payment, and the way the location works Monday through Friday.
In North County, the strongest pages are the honest ones. Florissant tends to reward buyers who want established housing and practical value instead of prestige branding. The right buy here is usually about condition, block, and commute pattern more than trend.
Grounded Context That Actually Helps
George's read: Florissant makes the most sense when a buyer is being disciplined about payment and is willing to judge the deal by block, condition, and layout instead of by zip-code prestige.
Why the Map Matters Here
Florissant sits in north county core, which means buyers usually evaluate it through the lens of access, block-to-block feel, and nearby service corridors. That is why comparing it only by city name misses the point. In this part of the metro, the micro-location often matters as much as the municipality itself.
What Buyers Actually Find Here
What buyers actually find in Florissant is a wide mix of ranches, split-levels, condos, and later suburban subdivisions. The market is usually less about flash and more about whether the house solves the buyer’s real problem: payment, space, commute, or setting.
That is why Florissant is usually best judged against Black Jack, Hazelwood, Spanish Lake, not against the metro’s highest-status suburbs. Buyers who shop it on its own terms often find more house-for-the-money than they expected.
The Buyer Profiles That Usually Click Here
Value-first buyers who want an established house and a realistic monthly number.
Buyers comparing block, condition, and commute more than brand-name prestige.
Households who want North County access without paying for trend-driven neighborhoods.
Buyers willing to judge the individual property instead of making assumptions from the map.
Wondering whether to stay or go?
If you’ve been in the house for years, start with Longtime St. Louis Homeowner: Should You Stay or Should You Go? — what staying really costs, what you’d walk away with, and where you’d go next.
Questions Buyers Ask Before They Commit
Where is Florissant?
Florissant is a municipality in St. Louis County, in the North County core of the St. Louis metro.
What is Florissant known for?
Buyers usually think of Florissant as one of North County's largest and most recognizable municipalities, with broad housing choice and strong everyday convenience.
Who is Florissant a good fit for?
Buyers who want options, services, and a familiar north county search target.
What do buyers usually compare Florissant against?
Common comparison searches include Black Jack, Hazelwood, Spanish Lake.
Want to Run Your Actual Search?
These numbers describe Florissant as a whole. Your search is narrower: a budget, a bedroom count, a house type and the things you won’t compromise on.
The useful question is how often that house has actually come up here, and what happened when it did. Ask me.
Grew up in South St. Louis, lived in Dogtown for 6 years, now in South County. You'll find us at Wellspring on Lindbergh on Sundays. I'm not selling you a house — I'm showing you how to think about buying or selling a house.
Complete St. Louis Home Buyer Guide
From pre-approval to closing day — see the complete buying process with all resources organized by stage.
📚 View Complete Guide